Transform JSON into Visual Graphs
Convert your JSON, YAML, XML, CSV, TOML, or TOON into stunning interactive graphs in seconds. Ideal for developers, analysts, and data pros—enjoy a seamless editing experience with smart diagrams, beautiful themes, and one-click export.
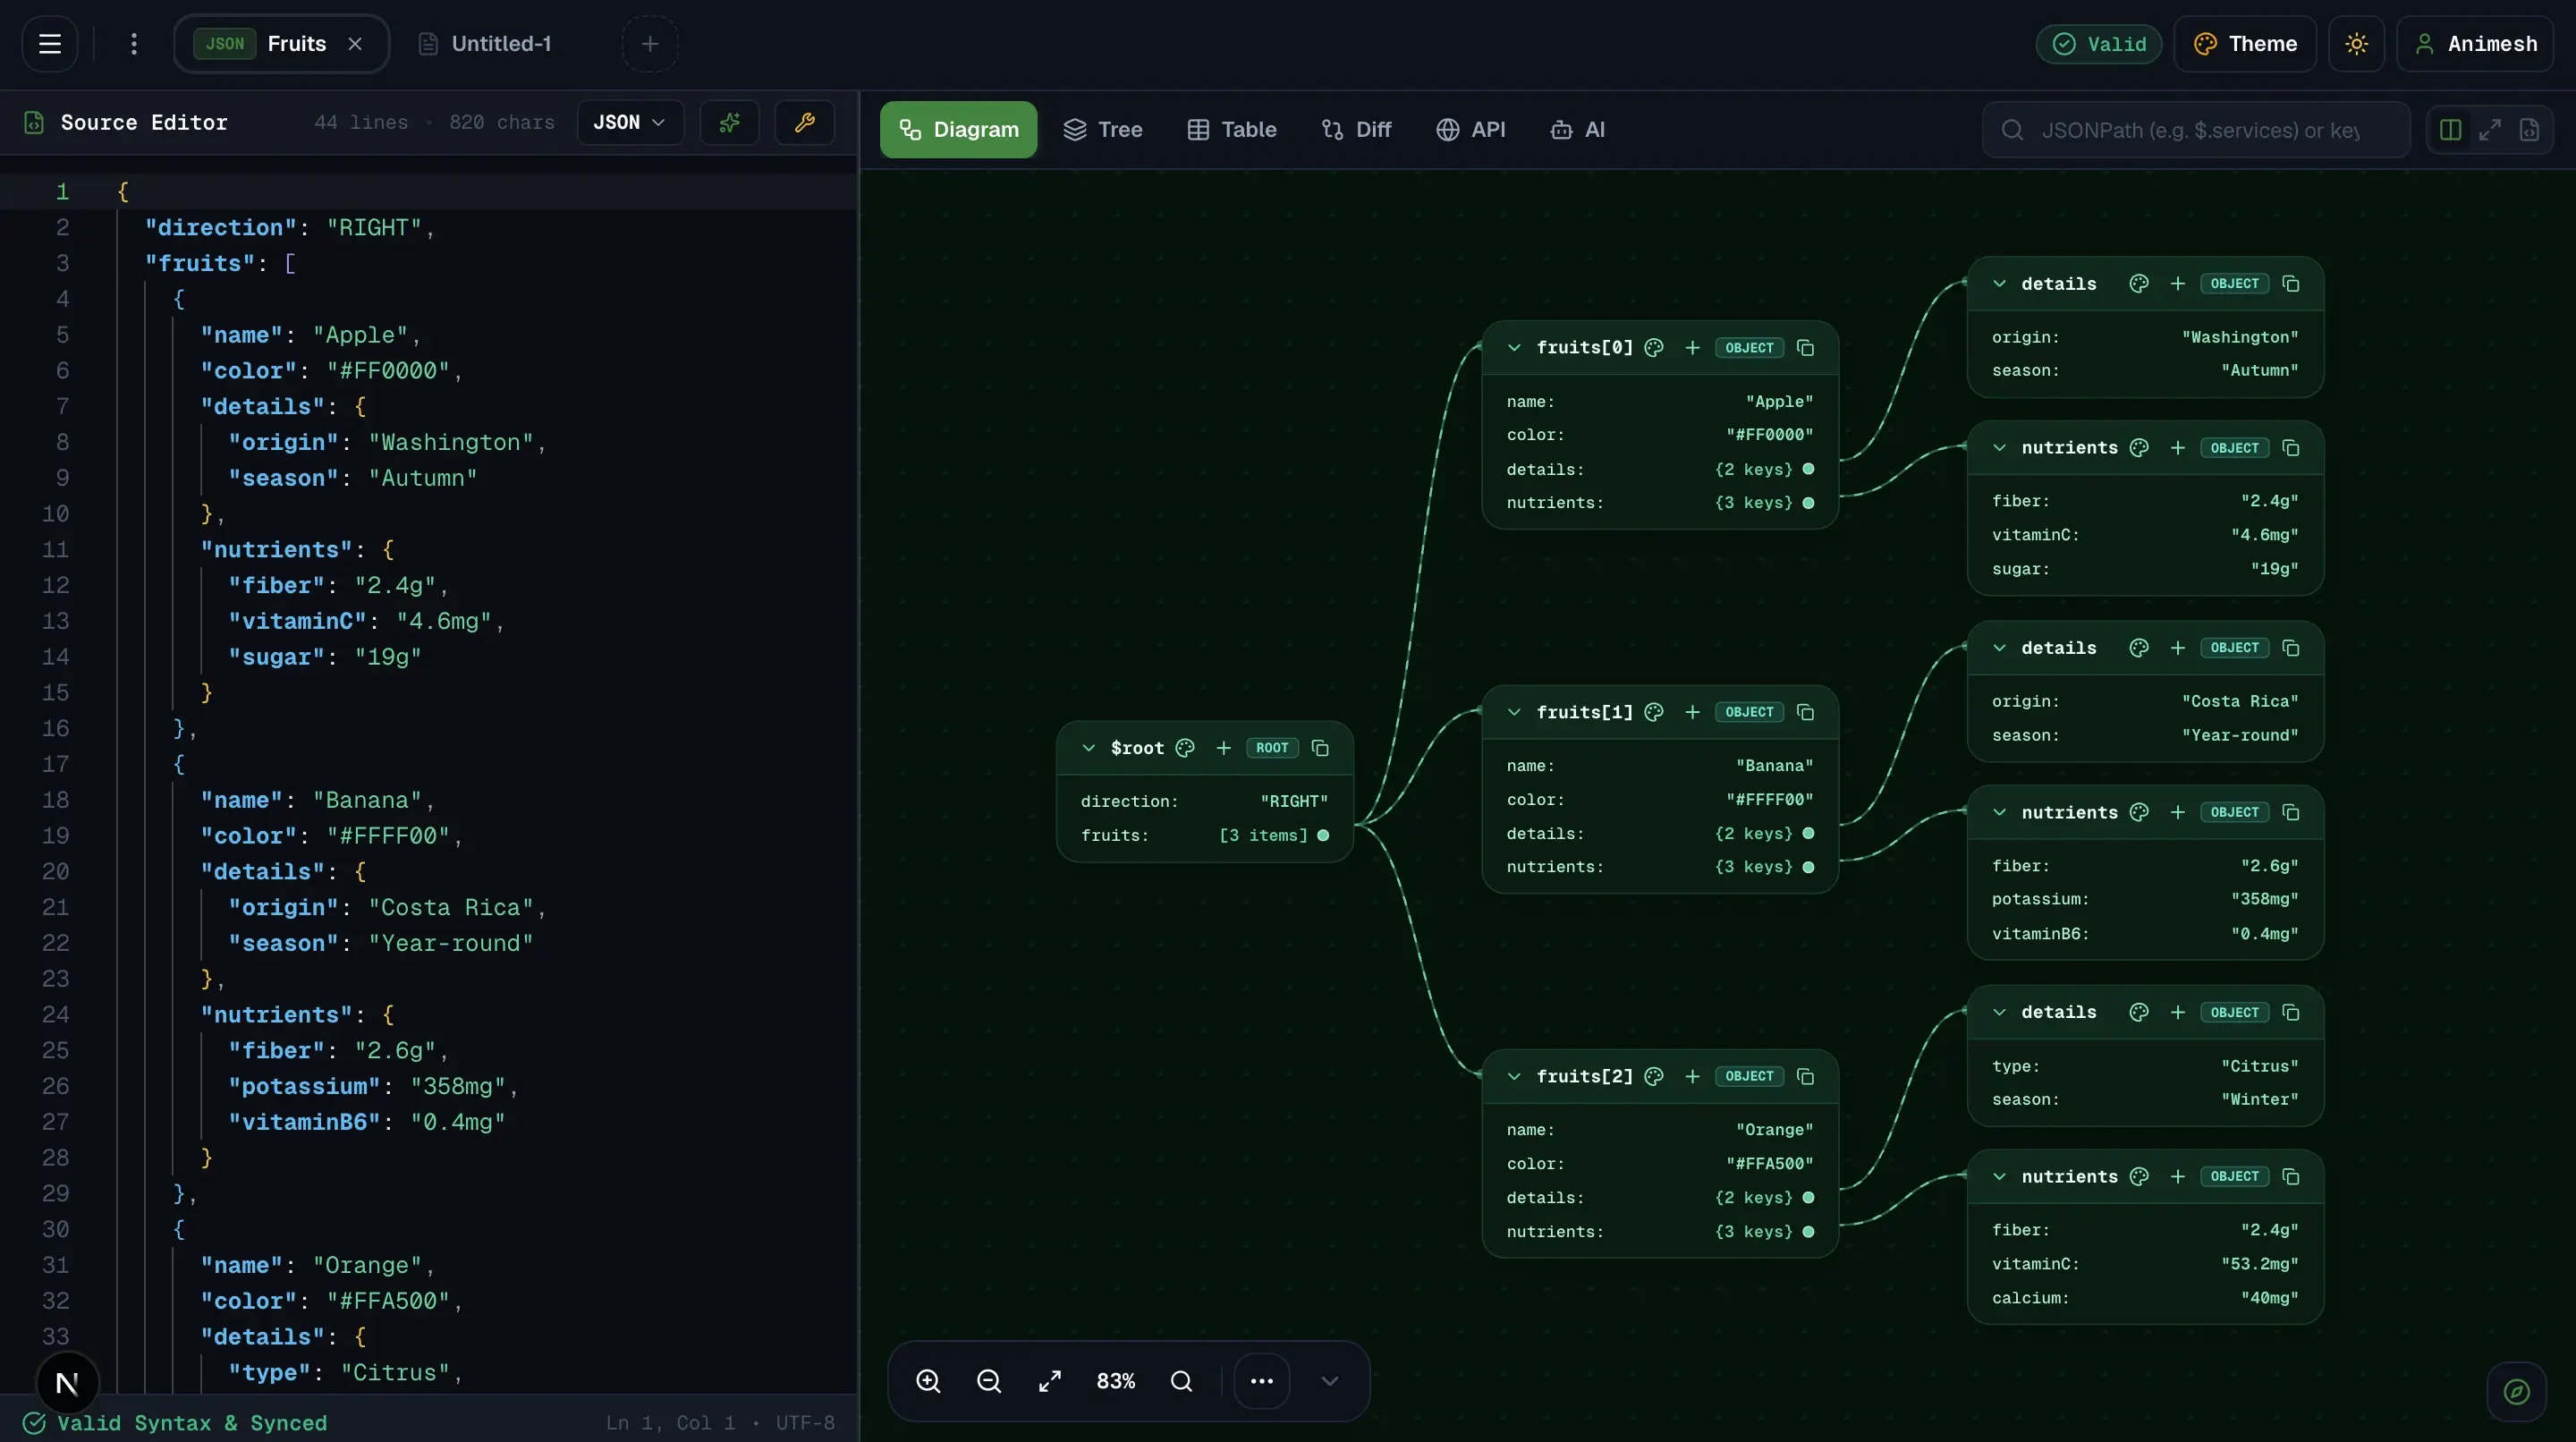
Visualize JSON Anywhere, On Any Platform.
Whether inside Chrome while testing REST endpoints, inside VS Code during active development, or on your mobile device—JSON Viewer travels with you.
Chrome & Edge Extension
Automatically turns any raw JSON URL or highlighted API text into an interactive SVG diagram and formatted tree inside Chrome.
- Zero setup, 100% free with no tracking
- One-click toggle: Graph vs Tree vs Raw
- Works on localhost, staging & private VPCs

VS Code Visualizer Extension
Inspect JSON, YAML, and CSV files side-by-side in real-time right inside your editor workspace without context switching.
- Real-time live graph updates as you type
- Schema constraint errors flagged inline
- One-click SVG export for GitHub PRs
Native Mobile Apps
Stop scrolling walls of raw JSON on your phone. Pinch, zoom, format, and share diagrams on the go with zero cloud tracking.


Pro Capabilities for High-Velocity Teams.
Everything you loved in JSON Viewer, updated with studio-grade performance, rich interactive media, and seamless export options.
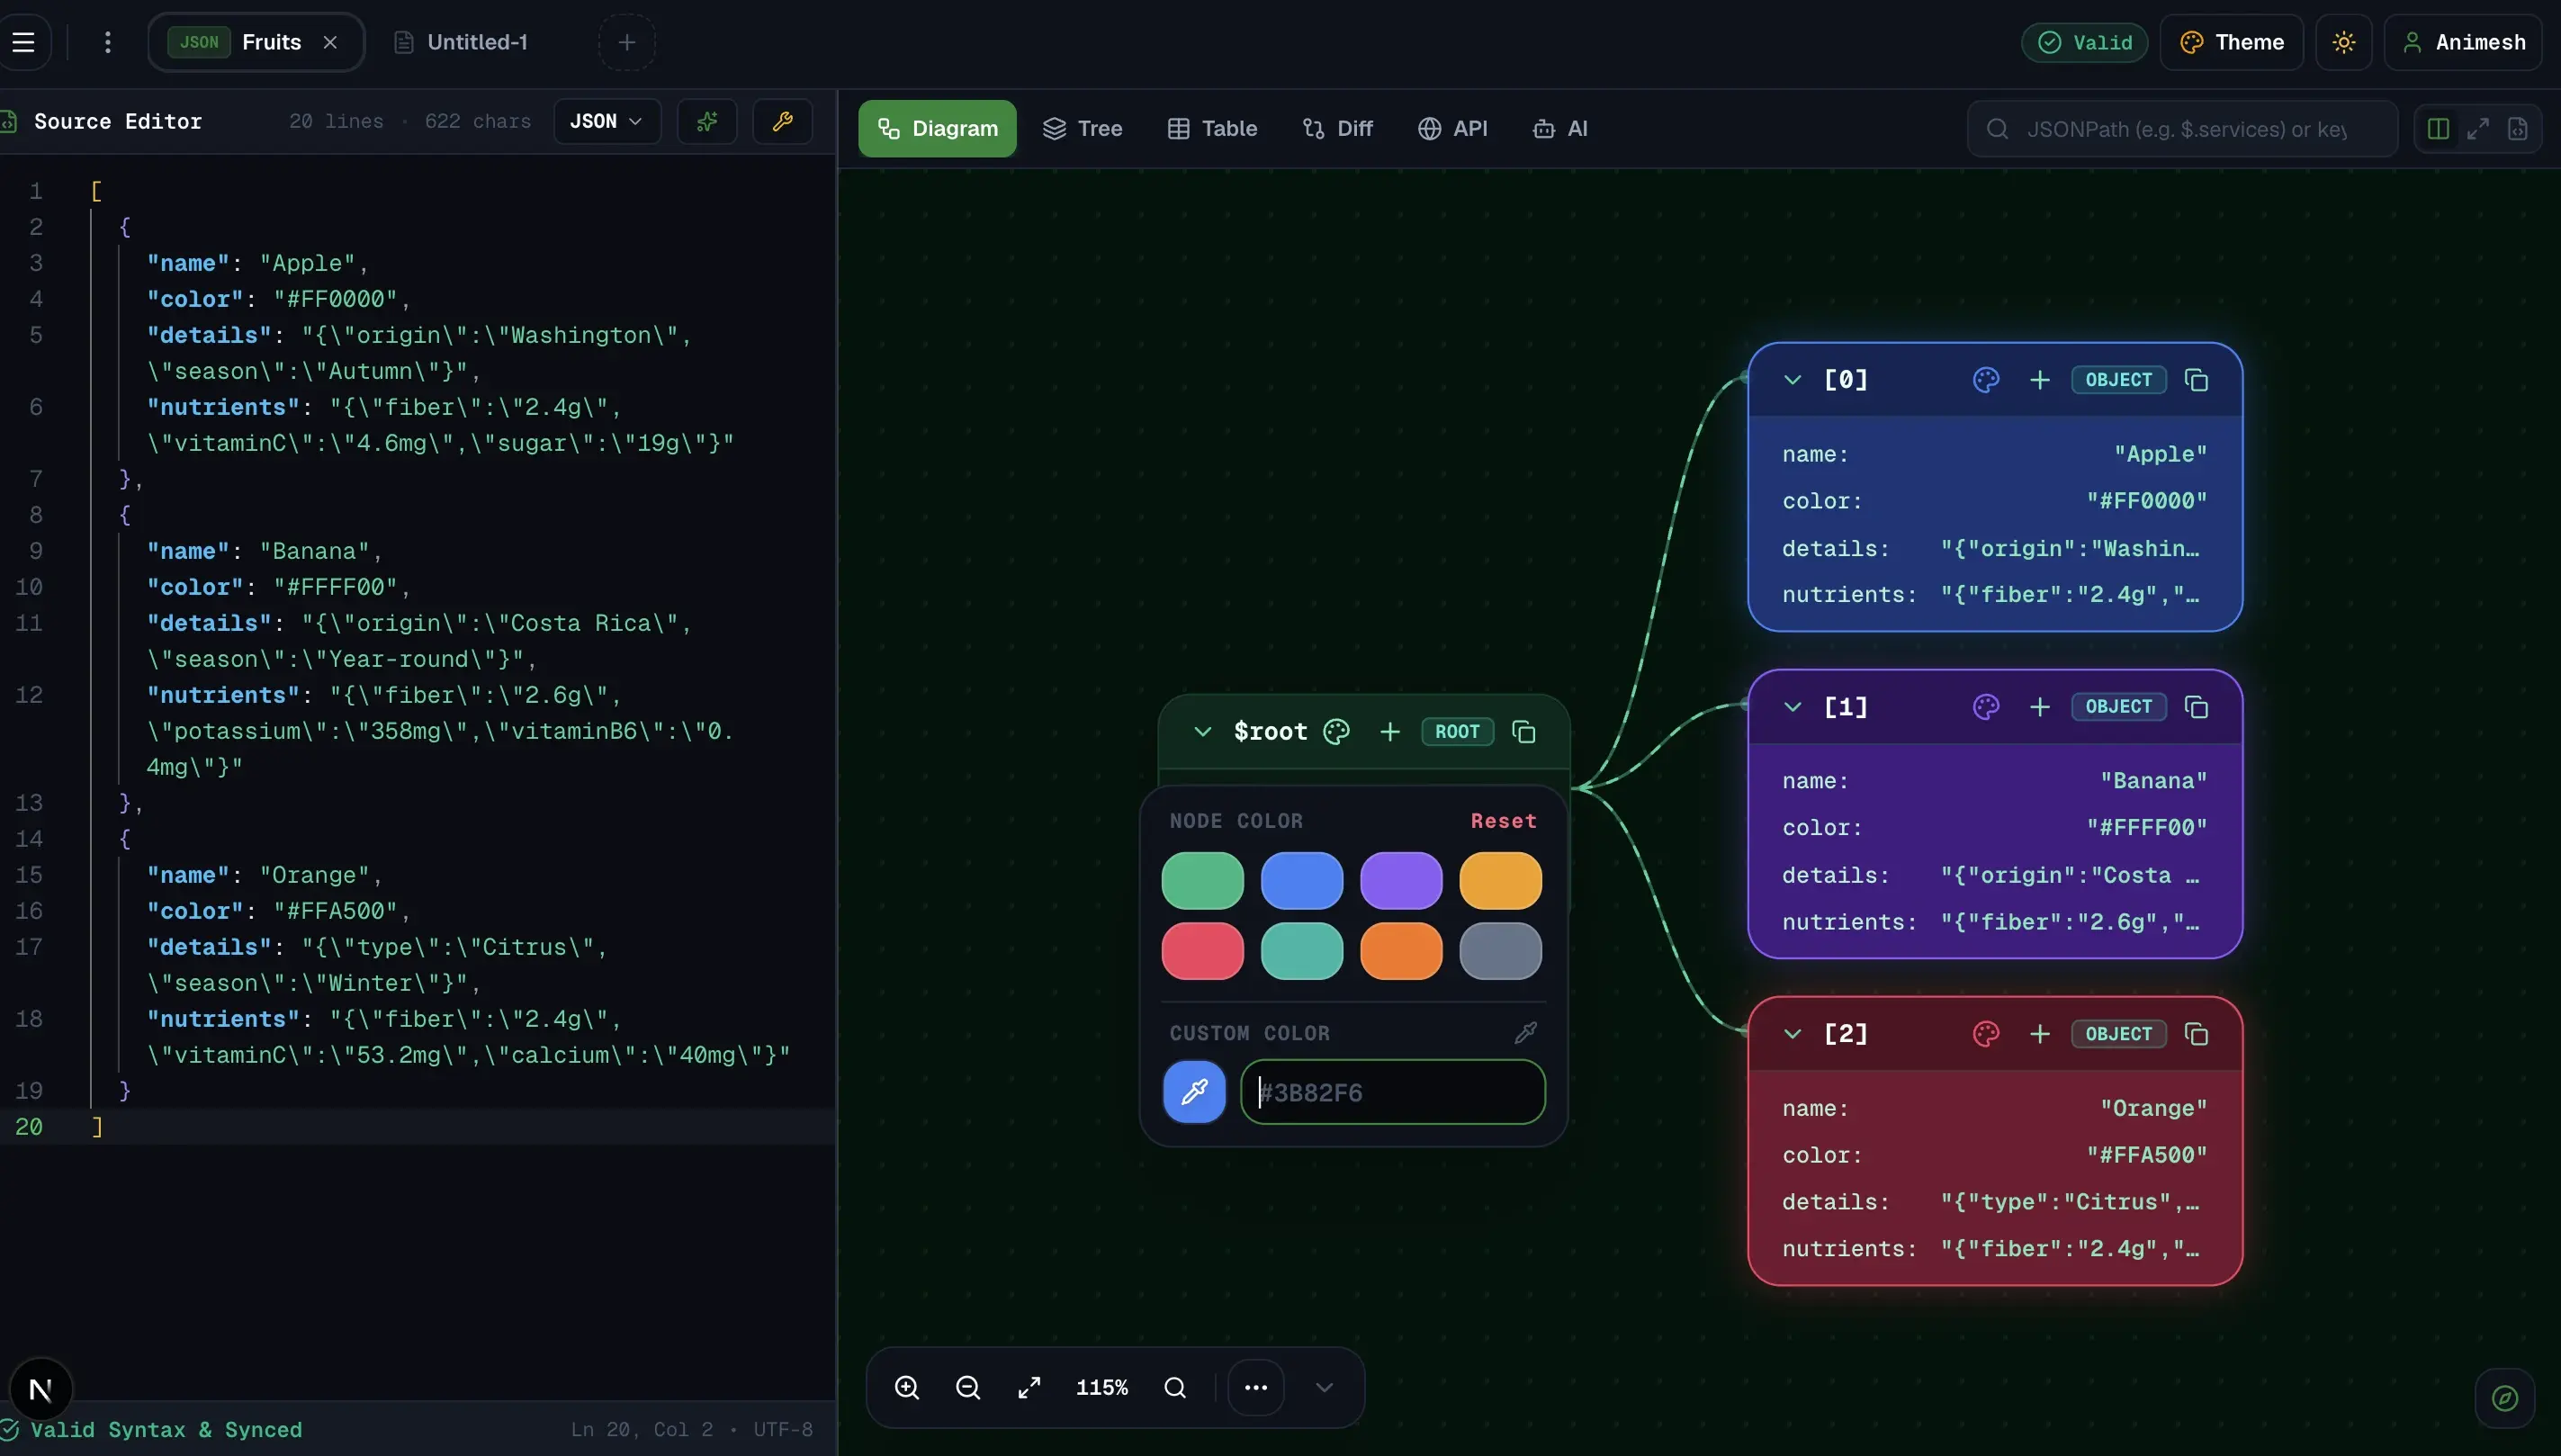
Multi-Node Color Customization
Easily customize colors for multiple nodes in your JSON visualization to make complex data easier to understand. Highlight different nodes with unique colors to quickly identify structures, relationships, and important parts of your data. This feature helps improve readability and visual clarity when working with large JSON diagrams.
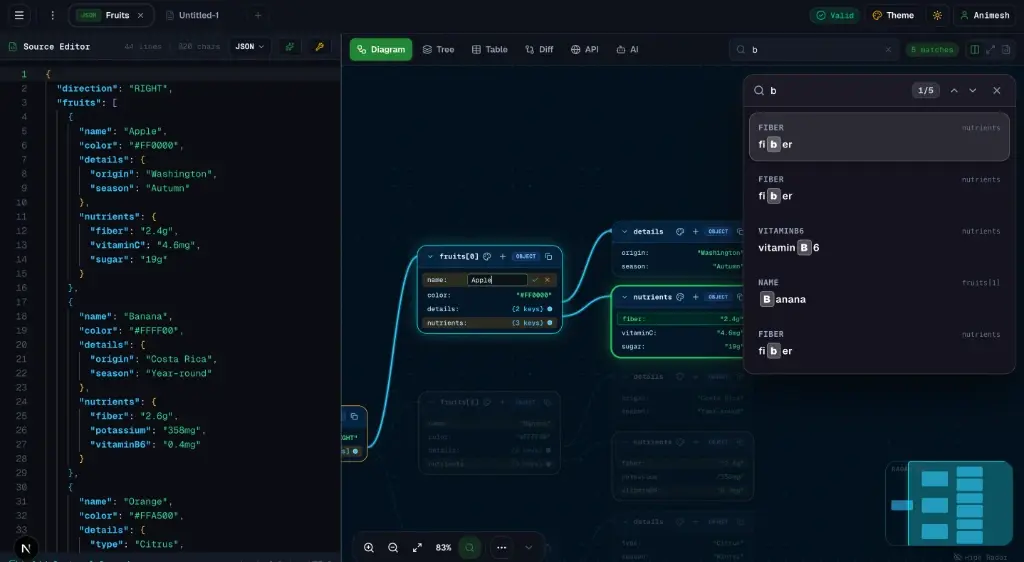
Search & Edit JSON Directly from Graph
Quickly search and edit JSON data directly from the visual graph interface. Use the powerful search bar to instantly find specific nodes in your diagram, then update values directly from the graph view without switching back to raw JSON. This makes it easier to explore, modify, and manage complex JSON structures visually, saving time and improving productivity when working with large datasets.
Visualize JSON Anywhere on the Web
Instantly visualize JSON data directly in your browser with our Chrome Extension. Simply select any JSON text on a webpage and transform it into an interactive visual diagram—no copying or pasting required. The extension is 100% free with no hidden costs, helping developers quickly understand and explore JSON structures while browsing.
One dataset. Three powerful lenses.
Don't get locked into one visualization style. Switch instantly between interactive node graphs, collapsible key trees, and tabular spreadsheets.
Don't read raw git diffs. See what broke visually.
Compare API v1 vs v2, staging vs production, or schema versions. Added fields, deleted keys, and type mutations light up on the architecture map.
Simple Pricing for Everyone
Get started on our free plan and upgrade when you are ready.
Free
Perfect for viewing and exploring JSON data.
- Upload & Process Small Files
- Powerful Chrome/VS Code Extension
- Unlimited Downloads – No Restrictions
- Visualize Data with Tables, Charts & Essential Tools
Pro
Ideal for advanced JSON analysis and data management.
- Ad-Free Experience
- Compare & Analyze Data
- Edit JSON Directly from Diagrams
- Unlimited Diagrams & Customization
- Personalized Themes
- Unlimited Downloads (No Watermark)
- Save and Share Documents
- API Access
- Support Large Files
- AI-Powered Assistant
- Android/IOS App
- Updates & Support
Edit your data or your diagram.
Both stay in sync.
Change a value directly in the visual diagram card—the raw syntax updates immediately. Edit the code—the diagram node redraws in 0ms.
Catch bad data before it ships.
Attach any JSON Schema draft or let the editor auto-infer constraints. Failing paths light up directly on the diagram canvas so you know immediately which node and field broke.
Built for Performance & Privacy.
Strict local browser execution. No telemetry on your JSON content. No cloud storage of your payload data unless you explicitly save it.
100% Client-Side Privacy
Your data never leaves your device or browser. Parsing, syntax checking, and diagram rendering happen entirely on your machine. Ideal for sensitive HIPAA, SOC2, and proprietary company payloads.
Engineered for Extreme Scale
Designed to handle massive payloads exceeding 50MB and 25,000+ nodes without crashing your tab. Dynamic viewport culling ensures consistent 60FPS fluid pan and zoom performance.
Universal Cross-Format Engine
Seamlessly switch between JSON, YAML, XML, CSV, TOML, and TOON diagrams. Automatic format sniffing auto-detects syntax and renders the optimal graph hierarchy instantly.
Stop scrolling raw text.
Start understanding your data.
Now available on Android and iOS. A smarter way to explore structured data on phones and tablets with fluid pinch-to-zoom diagrams and offline privacy.


Get started with JSON Viewer
Experience the power of visualizing your JSON data instantly. Paste your payload and explore interactive graphs, clean tree views, and powerful diff tools — all in one place.
Start Visualizing JSON FreeFrequently Asked Questions
Everything you need to know about privacy, mobile apps, formats, exports, and subscriptions.
Guides, tips & news
from JSON Viewer.

JSON Viewer Now on Android: Visualize, Edit & Share JSON on the Go
The wait is over! JSON Viewer is officially available on the Google Play Store. Inspect nested API payloads, debug payloads on mobile, and generate topology diagrams anywhere.

How to Visualize Website Structure from XML Sitemap with jsonviewer.tools
Turn raw XML sitemaps into interactive diagrams to explore your website's URL architecture, diagnose orphan pages, and simplify technical SEO hierarchy audits.

How to Visualize Any GitHub Repo's File Structure with jsonviewer.tools
Visualizing your GitHub repository file tree as an interactive diagram makes code onboarding, architecture reviews, and monorepo refactoring effortless.